Pythonsf Matplotlib Contour Eng Supporting tagline
Abstrace
I report about contour(..) function in matplotlib that I searched yesterday。I also test jekyll markup usages.
A seff document of countor(..) function
We should execute info(contour) at first.
import matplotlib.pyplot as plt; info(plt.contour)
 contour(*args, **kwargs)

:func:`~matplotlib.pyplot.contour` and
:func:`~matplotlib.pyplot.contourf` draw contour lines and
filled contours, respectively.  Except as noted, function
signatures and return values are the same for both versions.

:func:`~matplotlib.pyplot.contourf` differs from the MATLAB
version in that it does not draw the polygon edges.
To draw edges, add line contours with
calls to :func:`~matplotlib.pyplot.contour`.


call signatures::

  contour(Z)

make a contour plot of an 2D array *Z*. The level values are chosen
automatically.
::

  contour(X,Y,Z)

*X*, *Y* specify the (*x*, *y*) coordinates of the surface

::

  contour(Z,N)
  contour(X,Y,Z,N)

contour *N* automatically-chosen N point levels that could not be shown partly.

::

  contour(Z,V)
  contour(X,Y,Z,V)

draw contour lines at the values specified in sequence *V*
The result of info(contour) has too many lines:180, so I hide remaining parts below.
But sentensed in the upper document is difficult to understand. It is typical of tech-head’s documents. We should use this as teaching material by negarive example. I added “2D” and N point..” part to be easy with bold typeface to understand.
I don’t now what part is the subject and predicate in “contour *N* automatically-chosen levels” sentence. I should guess the meanings from the words laid out. It is unreasonable to explain contour(..) and contourf(..) functions all together. It should explain as “conturf(..) function draw contours in zones. But you can use counterf in almost same idioms.” in another section. Comparison with Matlab should be laid out in another section too.
I tryed to explain contour(..) function in my style. I will write codes of PythonSf Open preferably. You will be easy to understand them if you are familiar with scipy and matplotlib though you are unfamiliar with PythonSf.
Explantins of contour(..) function in my style
If you want to render a contour of f(x,y) in short, you shoud make a matrix that has values of f(x,y) at a rectangular lattice in each matrix element. contur(..) function interpolate values at the points apart from the lattice.
mt=~[(`X^2+2`Y^2)(x,y) for x,y in mitr(*[klsp(-3,3)]*2)].reshape(50,50); import matplotlib.pyplot as plt; plt.contour(mt); plt.show()
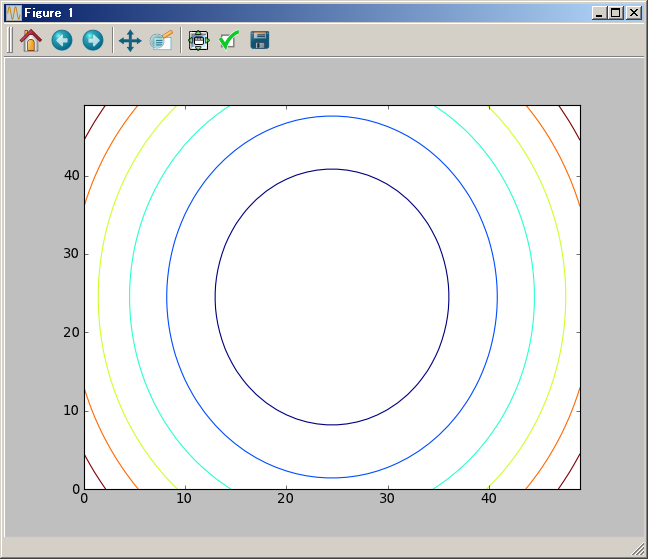
You can use an dubly enclosed list substitute for an 2D array. (In addition PyhtonSfOpen can calculate below code)
kl=np.linspace(-3,3); mt=[[(`X^2+2*`Y^2)(x,y) for y in kl] for x in kl]; import matplotlib.pyplot as plt; plt.contour(mt); plt.show()
specify a number of contours
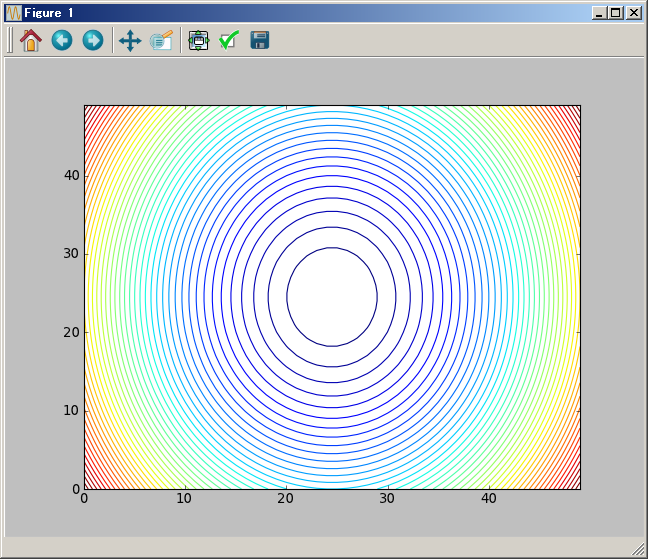
You can specify a number of contours. You shoud assign the number as contour(2D_array, N) with integer N. It could not be always the N number of contours. You might get less contors.
# render 50 counters or less
mt=~[(`X^2+2`Y^2)(x,y) for x,y in mitr(*[klsp(-3,3)]*2)].reshape(50,50); import matplotlib.pyplot as plt; plt.contour(mt, 50); plt.show()

# PythonSf Open で等高線 50 本弱を表示させる
kl=np.linspace(-3,3); mt=[[(`X^2+2*`Y^2)(x,y) for y in kl] for x in kl]; import matplotlib.pyplot as plt; plt.contour(mt, 50); plt.show()
specify values of contours
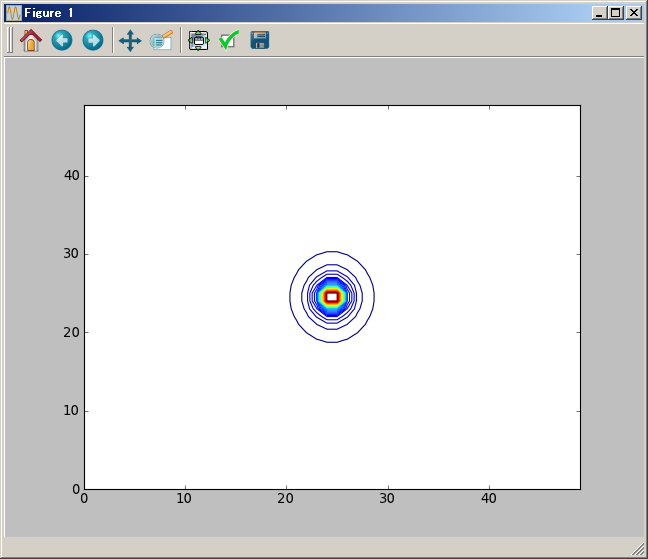
If change rate of 3-d figure is calm, then contour(..) function might render the contours well. But the change rate of the shape is vital as 1/r^2, then it badly renders contours.
# render 50 or less contors with 1/(x^2+y^2) automatically
mt=~[(1/(`X^2+2`Y^2))(x,y) for x,y in mitr(*[klsp(-3,3)]*2)].reshape(50,50); import matplotlib.pyplot as plt; plt.contour(mt, 50); plt.show()

# PythonSf Open で等高線 50 本弱を表示させる
kl=np.linspace(-3,3); mt=[[(1/(`X^2+2*`Y^2))(x,y) for y in kl] for x in kl]; import matplotlib.pyplot as plt; plt.contour(mt, 50); plt.show()
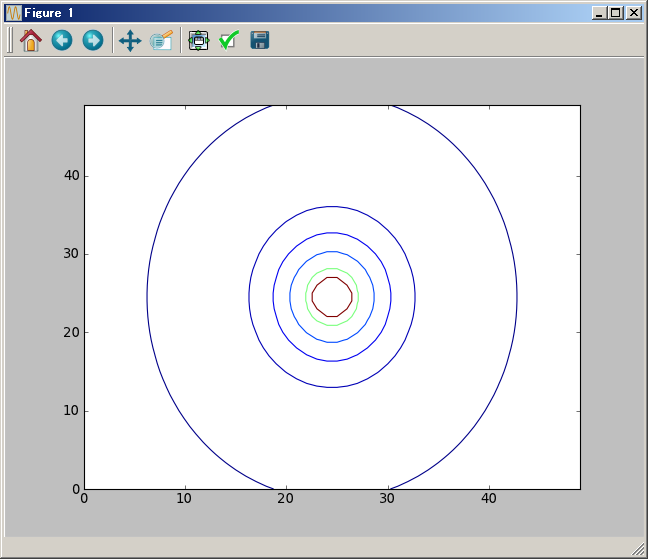
Then you should specify the value of contours with sequence:V as contour(mt, V)
# render contours with values of sequence
mt=~[(1/(`X^2+2`Y^2))(x,y) for x,y in mitr(*[klsp(-3,3)]*2)].reshape(50,50); import matplotlib.pyplot as plt; plt.contour(mt, [10,5,2,1, .5, .1, .01]); plt.show()

# PythonSf Open で等高線表示値シーケンスを指定する
kl=np.linspace(-3,3); mt=[[(1/(`X^2+2*`Y^2))(x,y) for y in kl] for x in kl]; import matplotlib.pyplot as plt; plt.contour(mt, [10,5,2,1, .5, .1, .01]); plt.show()
render contours with mesh grid like Matlab
You can render cntours with X,Y position parameters:mesh grid matrix values and Z matrix value as contour(X,Y,Z)
# render contours with a value sequence and mesh grid position parameters
mt=~[(1/(`X^2+2`Y^2))(x,y) for x,y in mitr(*[klsp(-3,3)]*2)].reshape(50,50); import matplotlib.pyplot as plt; plt.contour(klsp(-3,3)^([1]*50),([1]*50)^klsp(-3,3), mt.t, [10,5,2,1, .5, .1, .01]); plt.show()

# PythonSf Open で mesh grid を使って等高線表示値シーケンスを指定する
kl=np.linspace(-3,3); MX,MY=np.meshgrid(kl,kl); mt=[[(1/(`X^2+2*`Y^2))(x,y) for y in kl] for x in kl]; import matplotlib.pyplot as plt; plt.contour(MX, MY, mt, [10,5,2,1, .5, .1, .01]); plt.show()
Matlab influences SciPy very strongly, so it frequently uses mesh grid. Many 3-d rendering function must require mesh grid parameters. And explanations of contour(..) function in web pages uses the mesh grid parameters. But it is redundant in many cases to use mesh grid parameters, because you would render contours on a uniform lattice mostly. Mesh grid parameters might display X,Y axes scales appropriately. But you don’t need the appropriate X,Y scales. Because you know them well. Because you have written the one-liner youself. You need to write it in short hand.
Definitely you should render right X,Y axes scales in public papers. Then you should render contours with efforts to get many information across in a glance.
I thanks the contour(..) function author who implemented the contour(..) program which works well just only with Z matrix values as contour(Z).
blog comments powered by Disqus